Friday, April 6, 2018

Can We Expect Further Downside in US Stocks?

The recent turmoil in the markets has some investors and traders nervous. That is almost to be expected. We have a smooth bull market for years now, and the correction in February was violent. The S&P 500 fell from a high of 2873 to a low of 2634. On the 9th of that month, the low was put in on high volume, seemingly as buyers stepped in to get some perceived deals. Over the next month, we traded higher, with the S&P tagging the 2800 level. Then the trouble began again. Since then, we have seen the S&P trade lower, almost taking out its February low. On April 2nd it closed just above 2580, just 7 handles away from the February low. We currently sit at 2600, well off of that low, but not quite in a place where we can feel comfortable.

My take is that until we close above the low that was put in between the two peaks, it is a good idea to stay away from stocks. If we should close above that (blue horizontal line), I think that the path of least resistance is higher. If we close below the 2580 (red horizontal line) level, then I think further downside is most likely.

                                                                    S&P 500 Daily

This is only taking into account one factor, however: the actual S&P 500. There are a lot of other markets we should be looking at to make a call about stocks. Here, I want to take a look at financial stocks.

XLF, the financial sector ETF, closely tracks the stock market. Some might say it even leads the stock market. This should be no surprise, because the big banks have a good vantage point on the overall economy. If they aren't doing well, then there is a good chance that no one is. One key difference between the S&P and XLF during the recent volatility: XLF actually closed at fresh lows and the S&P did not. Even so, we have seen a bounce in the financial stocks. The same lines and ideas apply to the XLF chart below: above blue is a healthy sign, below red is not a healthy sign.


                                                                       XLF Daily

Before we continue, it is important to note the other line on these 2 charts: the 200-day exponential moving average. This is a key level that many large investors and traders watch. So far it has acted as a rough level of support. It is also near the lows that each market closed at. It is an important line to watch. Let's also not lose perspective. Despite the strength in financial stocks, XLF has yet to close above the highs that preceded the 2008 crash.

                                                                        XLF Weekly

The components of XLF are important to look at, because, well, they make up the ETF. The 6 biggest components are: Berkshire Hathaway ($BRK.b), JP Morgan ($JPM), Bank of America ($BAC), Wells Fargo ($WFC), Citigroup ($C), and Goldman Sachs ($GS). Of these, Berkshire, Wells Fargo, and JP Morgan are well above their pre-crisis highs. Goldman Sachs is above its pre-crisis high as well, but just barely. Languishing, we have Bank of America and Citigroup. Given the different positions of these components relative to their pre-crisis highs, it isn't a surprise to see XLF struggling a little bit, albeit close to its own highs.

When you look at the major financial stocks on a shorter time frame, they look quite similar to the S&P 500. Below are their daily charts. Again, I am watching 2 levels: the level to hold to the downside and the level we need to get through to the upside. I believe it is important to keep an eye on all of these, because if one begins to slip, the others could follow.

                                                $BRK.b looks strong and is above key resistance

                                              $JPM is just trading at its key resistance level right now

                                                       $WFC is very ugly. Relatively weak and below key levels


                                               $C falls into the middle of the pack. It is midway between key levels

                                                 $BAC is holding up well, nearer to highs than the others

                                             $GS is also holding up relatively well

Again, there are many pieces to look at to figure out what is going on: economic data, international markets, breadth indicators, ratios between different sectors, and more. This is just one piece of the puzzle. Many market participants like to try to predict what is going to happen next. I believe that you need to wait for the market to tell you. Right now, the market is in a state of indecision, and until some of the above-mentioned levels are breached, we will likely remain in this state.

Wednesday, April 4, 2018

"AlphaGO" Documentary and its Applications to Trading

"Lee Sedol is very patient. He wait, he wait, he wait his moment. I feel something, he looks like the wolf, wait in the forest, in the winter. He cold, he feel very, very cold. But he need patience. But the moment is coming...he go out to attack."

                                                         Lee Sedol playing against AlphaGo

While observing the fourth out of five games between Lee Sedol, who is a world-renown Go player, and an AI created by DeepMind, Fan Hui , another high level Go player, makes this observation. Fan Hui was handily beaten by the AI prior to this tournament. English is not his native tongue, but I do not think that the quote requires translation. This particular quote stuck with me because of its translation to trading; the level of patience required is high. You must sit, watch, and wait, even if it is cold, like Fan Hui's wolf.

                                                             Fan Hui playing a game of Go

AlphaGo is a computer program designed to compete in the highly competitive game of Go. There is a good chance that you may not have heard of this game. It is mostly popular in Korea and China. It originated in China 3,000 years ago. While the rules are simple, with the goal being to capture an opponent's pieces or surround empty space to gain territory, "Go is a game of profound complexity." Sound familiar? It should to any trader. The rules to the trading game are simple: buy low, sell high, or sell high and buy low. Trading is also a game of profound complexity however, because following those simple rules is a tantalizing challenge.

                                                                       Go board

Another quote regarding the game of Go that can be applied to trading comes from DeepMind's website: "Go is played primarily through intuition and feel, and because of its beauty, subtlety and intellectual depth it has captured the human imagination for centuries." So, it appears we have some similarities between the game of Go and trading. Both are deceptively complex; in the game of Go, there are 10 to the power of 170 possible board configurations, which is more than the number of atoms in the known universe. In trading, the markets can display an almost infinite amount of configurations across time frames. Both games require intuition, which is generally derived from experience. The human brain is powerful and much information resides in the supercomputer that is our subconscious mind. In both Go and trading, when we see a situation that we have seen in the past but we can't consciously recall, we often get a gut feeling or a hunch. Or intuition. In simpler systems, we don't need to rely on this intuition as much. But with such a vast quantity of data to process from a more complex system, we need it.

One of the biggest factors that impedes traders across all markets, asset classes, and time frames, is the constant swim against the current that is human emotion. Human beings have evolved in certain ways since the birth of our species. We can run long distances as no other animal can. We are able to communicate in a much more complex manner than any other creature, leading to what has become a more and more interconnected world. One skill that we did not develop through evolution, however, was the skill of trading in the financial markets. As a matter of fact, for the vast majority of us, the way we are built leads to a wildly error-prone decision-making method. This is not news. The fact that we naturally lack skill at trading has been the subject of many books, blog posts, and papers.

As we continue to harness the power of technology, we are seeing computers become more and more prevalent in the trading world. The initial purpose of these trading systems was to eliminate the human decision making factor. A trader may have had a system that he was executing manually. Let's say that it was a trend-following system that got long when 3 exponential moving averages were below the market and moving higher and a key resistance level was broken. Nothing in the trading world works 100% of the time. And the nature of trend-following, in many cases, is that of many small losses and a couple of large wins that more than offset the losses. But after a trend-follower takes 10 losses in a row, is he going to have the gumption to stick to the system? What if he skips the next trade, which is the big win that he needed because he is scared of another loss? This is an all-too common problem in our world.

So what did the computer-savvy traders do? They simply took their rules, tossed them in a black box, and let the computer execute the trades. Generally, back-testing was done to reinforce confidence in the system. The trader might recognize that, indeed, 10 losses in a row are possible. But according to back-testing on a massive amount of data, that's fine and the system will still be profitable overall.

Coding clear-cut rules to trade the markets is not the daunting task that it once was. There are languages specifically designed for this purpose. But what if the rules aren't so clear cut? What if a trader is relying on his intuition in addition to some rules? What if a Go player is relying on his gut to help guide his decision-making? How can that be coded? How can you possibly code something that you can't explicitly quantify?

 "...[AlphaGo] combines Monte-Carlo tree search with a deep neural network that have been trained by supervised learning, from human expert games, and by reinforcement learning, from games of self-play."

So what is a Monte-Carlo tree search and what is a deep neural network?

 A Monte-Carlo tree search is simply the analysis of the most promising moves. The search tree expands based on a random sampling of the search space. Many games must be played in order for the tree search to be effective. The game, in this case, Go, is played out until the end using random moves. The final result is then used so we know which moves are going to be better in future games. We are trying to find the moves that have most frequently led to victories. Sound familiar to any traders reading this?


Above is a diagram of the 4 steps in the tree search for one decision. This shows the number of plays that were won by each color (white or black). In this scenario, black is about to move. The 11/21 in the root indicates the number of white wins our of the total plays from this position. Here, white lost and the black nodes get the wins. "This [process] ensures that during selection, each player's choices expand towards the most promising moves for that player, which mirrors the goal of each player to maximize the value of their move."

One major issue with using this method is that it can be applied to a game that has a finite number of moves and a finite length. So the tree search method may be useful for Checkers, Chess, or Go. But the markets are not finite in anyway, aside from trading limits. Anything can happen. One trader could trigger a cascading effect of stops being taken out, resulting in the market breaking down and making a laughing stock of any theories about normal distribution.

Another disadvantage is that when the game faces an expert player, like Lee Sedol, there might be a single branch that was missed during the tree search that leads to a loss for the AI. There is speculation that this is how Lee Sedol won game four. On a quick aside, what an absolute master of pattern recognition to be able to find that "branch."

An artificial neural network, or an ANN, is based on a collection of nodes which are called Artificial Neurons. This name comes from the fact that humans and animals have neural networks, albeit not "artificial." This is an image of what our actual neural networks look like:


And this is a diagram of an artificial neural network:


What the ANN does is improve its performance progressively. For example, an ANN might scan a chart that has been labeled "bull market" or "bear market." With no inherent knowledge about what either one of those things are, the ANN will come up with its own delineating features as to what constitutes each one.

AlphaGo used both of these methods to become a master Go player. Before AlphaGo, researchers believed that an AI would never be able to beat a top professional. As we know, that turned out to not be accurate. I have similarly heard it said that an AI will never be able to beat a top human trader. The difference between Go and the markets is that one is a finite environment and one is boundless. Will that make a difference in how good AI can get? Once an AI has adapted to market conditions, will it be able to adapt again as well as a human being? Can an AI have observed so many market conditions that it will know what move to make next based on a form of intuition?


Many traders know that their particular style only works under certain market conditions. Knowing this, the trader can choose to shut things down during market chop. An AI can certainly be programmed to recognize these conditions as well. The trader can also adapt to trade a new market condition, without necessarily being able to quantify the change. An AI can also do this, but needs a way to quantify whatever the change is.

I'm sure many traders reading this have gotten a feeling that "something doesn't feel right" before. You might be long S&P futures. You can't put your finger on it, but something is telling you to bail. You can tell that it isn't an impulse, but rather intuition (differentiating between separates the good traders from the rest, in my opinion), so you exit. Sure enough, the market plummets. What did you see that triggered this signal from deep within? Was it a certain 5-minute candle and how the DOM was trading? It could be any combination of things that you have seen in the past. The key point is that you can't say exactly what it was, but exiting the trade felt like the right move.

For an AI to be able to make a similar decision, it would have to have a highly developed ANN that has observed many, many market scenarios. It seems like it would be an overwhelming and nearly prohibitively expensive task to develop an AI to be able to do this. Nevertheless, with the amount of money that is poured into trading technology, we can be certain that this is being attempted.

I still believe a good human trader can beat any trading AI or algorithm. For now. We really don't know how far we can push machines, and it is possible that eventually they become better traders than us, using some form of "intuition."


Sources: AlphaGo documentary, deepmind.com, Wikipedia

Friday, March 30, 2018

Q1 2018 - An Ugly Start to the Year

US stock markets were punished in the first quarter. Things didn't start the year on a negative note, however: January saw fresh all-time highs register on almost a daily basis. To my eye, 2018 was shaping up to be more of what we are used to. Then the volatility storm struck in February. Short VIX positions were blown out, some VIX ETNs stopped trading altogether, and the stock market fell into correction territory. Following a relief rally later in the month, it seemed that a lot of market participants thought that we were in the clear. March wasn't much better though, and seemed to catch some traders and investors off-guard. A bit of uncertainty over rate hikes and the possibility of a trade war are where the financial media puts the blame.

Copper was notably weak in Q1. Copper, the only market that has a "PhD in economics", hence its nickname "Dr. Copper," was down 8.4%. This is concerning given that the copper market is considered by many to be a barometer for the general health of the worldwide economy. Japanese and European stocks were weak too, making US stocks look good by comparison. The Nikkei lost 5.4% and Euro Stoxx lost almost 6%. The MSCI All-World Index ended a 7 quarter winning streak. Despite the turmoil in the FANG stocks, the NASDAQ was actually up on the quarter. The Dow and S&P both lost ground, with losses of 2.6% and 1.44%, respectively. Both indexes ended 9 quarter winning streaks. The USD was down for the 5th straight quarter, mostly against the yen and the British pound this time.

VIX was a big winner in the first 3 months of the year, with its biggest quarterly spike since 2011. Grain markets and energy also showed strength. Gold was slightly positive, but continues to show signs of uncertainty regarding its future direction.

March saw some major curve flattening. The 2 year-30 year spread fell to its lowest levels since 2007.

There are a couple major economic data points to consider. Change in Non-farm Payrolls failed to meet expectations in early January and the Unemployment Rate held steady at 4.1%. US CPI data released on January 12 showed a slight up tick when you exclude food and energy, rising from 1.7% to 1.8%. The BoJ continues to hold rates at a negative 10 basis points. Rates in the Eurozone are at 0%. The beginning of Febuary showed a beat in Non-farm Payrolls, with 200k jobs being created. Again, the unemployment rate remained at 4.1%. The RBA held rates at 1.5% and the RBNZ held rates at 1.75%. The BoE is holding rates at .50%. CPI data released in Febuary showed an uptick, beating the 1.9% expectation by 20 basis points. At the beginning of March, PCE Core was released, which is what the Fed looks at to get a read on inflation. That held steady, and met expectations, at 1.5%.  There appears to not be inflation, but is it possible that we just aren't looking in the right place, a la Alan Greenspan not noticing the inflation in the housing sector?

The Fed met on the 21st of March and raised rates by 25 basis points as everyone expected. The question now is whether we will see 2 or 3 more hikes this year. Next Friday's release of jobs data might give a hint.


US Stocks

January ended 5 months of gains in the S&P and 7 months of gains in the NASDAQ. The NASDAQ briefly put in fresh highs in March, but then fell. The S&P fell a bit harder, getting nearer to the February lows. Both indexes are above major trendlines and moving averages. Monthly charts:


Things get a little dicier on the daily charts (below). Here we can see the March decline in the S&P bringing us dangerously close to the 2530 low set in February. We are also below the 50 and 100 day moving averages, which is a sign of short-term negative sentiment. So far, the 2,600 level is holding. In the NASDAQ, we seem to be holding the 7,000 level for now. We closed out the month by testing the 100 day moving average. Again, being below both of these is indicating negative sentiment. Should we break the 200 day moving average, the 2,600 level in the S&P 500 (which is right at 2,600), I think further selling would be triggered.


The takeaway here is that the long-term bull trends are in-tact, but in the shorter-term, caution is warranted.


Metals

As aforementioned, copper was a loser this quarter. It was down all three months, closing out just above the 3.00 level. The daily chart here has a similarity to the daily equity charts above: we are decidedly below the 50 day and 100 day moving averages, but the 200 day moving average is in a more ambiguous situation. The low from December of last year at 2.9380 needs to be taken out before we can call this a downtrend. Below are the daily and monthly copper charts.


Keeping with the metals, we can see that the gold market has been moving sideways following its year-end rally of 2017. A low of 1240 was put in, and then we blasted off into the new year. Eventually a high of 1364 was put in. Since then, we have been moving sideways between that level and about 1310. A break below 1310 would indicate further downside.


The monthly chart reinforces the fact that this market has not been doing much. The formation here is bullish, and a break above the recent highers around 1360 would could mean a retest of old support above 1500. Long-term, I am bullish on gold, even if we see a breakdown below 1,300. For the longer-term pattern to be considered bearish, the low from late 2016 would have to be taken out.


Currencies

The dollar's daily chart shows 3 tests right around the 88.500 level. The fact that we are holding is a good sign for the dollar bulls. The fact that we have knocked on this door a few times is not such a good sign for dollar bulls. I would like to see a close above the high that was put in during March, around 90.750. That was the level where the possible double-bottom failed, but if we close above it, this would become a triple-bottom, and thus a major base.


The monthly chart paints a picture that is a bit harder to decipher. The most recent major move was the rally in 2014 and early 2015. Since then, 3 major highs have been put in. Following the most recent high, an extensive decline has taken hold. This is really a tough call, and I think at least a short-term bounce may be needed to shake out weak shorts. Perhaps then, further downside is possible.


The euro has spent most of 2018 consolidating between 1.22 and 1.25. All major moving-averages are holding, and the trend here is clearly higher. Given that the euro is a major component of the dollar index, this would indicate further dollar weakness.


You should not be too surprised that the monthly euro chart almost looks like a mirror image of the monthly dollar chart above. Here, we can see the 1.25 handle being tested.


The last currency to look at is the yen. Given its status as a safe-haven due to the carry trade, it has important ramifications for just about everything. In the past, the yen pairs have often shown high correlation to US stocks. Please keep in mind that when looking at these yen charts, they are inverse. Meaning that when prices are rising, that actually means the yen is falling in dollar terms. When prices are falling, the yen is actually rising.

The daily yen chart shows general strength versus the greenback. In February and March, we have seen 3 new major lows. We are below all major moving averages. The trend here is clearly lower.


On the monthly chart, despite the weakness (yen strength) so far this year, it still appears that this market doesn't know where it wants to go. When the moving averages cross and flat-line, as they have here, it indicates indecision. Generally I find it safer to bet on that indecision continuing rather than guessing which way the market will eventually move.


Crude Oil

Oil saw 5 months of higher prices coming into 2018. February was the first negative month following that rally. March saw another push higher. So far, oil prices have been unable to sustain above $66. We are above the moving averages and have put in multiple higher lows, indicating that buying pressure is still present. I think a pop through $66 is the most likely scenario. Above that, we might begin to see resistance form at old support. $75 would be a level to watch there.


Volatility

I just wanted to post a chart of VIX to put the recent spikes in perspective. The spike in February puts the spike in March to shame. That is to be expected, at least somewhat, given the violence of February moves. The structural problems of some VIX products also must be taken into consideration.


Bonds and Financial Stocks

Financial stocks, shown here as the $XLF ETF, have yet to take out their pre-Financial Crisis highs. We came close before the downturn in February. I like to watch this sector because it often gives clues as to what is going on in the economy before the other sectors or indexes do. The monthly chart shown here is still clearly bullish, but the potential resistance above from 2007 is worrisome.


The 30-year has turned higher while the 2-year has struggled. This means that longer-term yields are falling faster than shorter-term yields, and that the curve is flattening. This is generally interpreted as a signal that the Fed is tightening and could throw the US into another recession.

This is seen on the daily charts below. The 2-year futures chart is followed by the 30-year futures chart.


The last chart to look at is the monthly 30-year bond chart. Major lows were put in during February. March saw some respite, but as long as we are holding below the 148'00 level, I think bias remains to the downside.


For more information/detail on any of the markets discussed above, or if you would like analysis of another market, email your request(s) to jd.erdmier@gmail.com

Tuesday, January 2, 2018

2017 in Review

Stock markets up world-wide. Volatility crushed. The massive rally in Bitcoin and other cryptocurrencies. Geopolitical tension on the Korean Peninsula. The most controversial President in US history.

A lot happened in 2017. Let's look at the charts and let them tell the story. I am going to take a look at some markets on a couple of different time frames and then discuss possibilities for this year (and beyond).

Note: A "daily" chart means that each vertical bar is equal to one day's trading. A "monthly" chart means that each bar represents one month of trading. You can see the time scale at the bottom of the chart. Generally I have the daily charts set to just show 2017 and the monthly charts go much further back.


Stocks

The S&P was up 20% on the year. Every month was positive (on a total-return basis) for the first time in history. The Dow was up 25% and the NASDAQ was up 29%.

On the daily chart of the ES, we see an investor's dream. A clean, smooth rally. Pullbacks were mild and were followed by relatively quick returns to fresh all-time highs:


The monthly chart, with the exception of the Crash of '08, shows largely the same picture. Note that not all 12 months are green on this chart because these are the futures:


With stocks in the US being a big winner, a big loser was obviously volatility. There were a couple of spikes, but ultimately more lower lows and lower highs. The lows were record-setting, and the highs may have provided temporary hope to traders, but betting that a more exciting epoch was beginning would have led to sustained losses. We will see what happens in the beginning of 2018 following the end-of-year spike:


What next?

A trend in motion tends to stay in motion. There have been so many fundamental "reasons" to get short stocks over the past 8 years that it is impossible to keep track of. As long as the trend remains strong, stay long.

Be on the look out for any major topping patterns. Divergence (RSI, MACD) and declining volume seem to have lost their significance in a lot of this rally. If financial stocks begin to roll over, however, that could be an early warning sign.


Currencies

The US dollar was down this year against the majors, posting its biggest loss since 2003. Losing about 10.5%, exceptional weakness was seen against the euro and the British pound. Let's check out the charts.

Note: All charts are of the futures contracts, so they are against the US dollar. Meaning as one of these charts goes up, it means that currency is gaining relative to the US dollar. This can be a difficult topic for people to grasp, especially since in the spot market it is often the opposite, so just ask and I can explain further.


The Australian dollar's place was in the middle of the pack. It started the year strong, corrected, rallied, corrected, and then posted a nice year-end push higher. The .81 level (one Aussie dollar buys .81 US dollars) was breached in Q3, but was unable to hold:


I am bearish on the longer-term outlook for this currency. We are forming a possible rising wedge, as highlighted, on the monthly chart. Given that the trend leading up to this (until 2015) was down, this has bearish implications. To briefly dive into the fundamentals, it is relative central back policy that moves currencies. The Fed is set to continue raising rates into 2018, which will help the US dollar hold its ground. Monthly Aussie dollar chart:


The British pound was strong this year. Many higher highs and higher lows. 1.37 was almost touched (meaning at that time, one pound could buy 1.37 US dollars). There are a couple of lower trendlines to keep an eye on into the new year:


Similar to the Aussie dollar above, the pound is moving lower into a bullish formation. Here it is more channel-like than a wedge, but the message is the same. When the lower trendline is broken, expect lower prices:


Next up is the Canadian dollar. The year started off on a rough note for the loonie (not my nickname). After bottoming out in the .72 handle, the upper trendline was broken and a strong rally ensued. For most of Q4 we were seeing consolidation, but like the Aussie, a strong rally was posted at the end of the year. It is worth noting that both the Aussie and the Canadian dollar are commodity currencies, meaning that since they export a lot of gold and oil, respectively, their prices tend to have some correlation with those markets. Daily loonie chart:


Are we seeing bottoming out on the monthly chart or is this another downtrend leading to a wedge which could be followed by another leg lower? We see a bottom in 2015 here, right at .68. Since then, we have had a higher low and 2 higher highs:


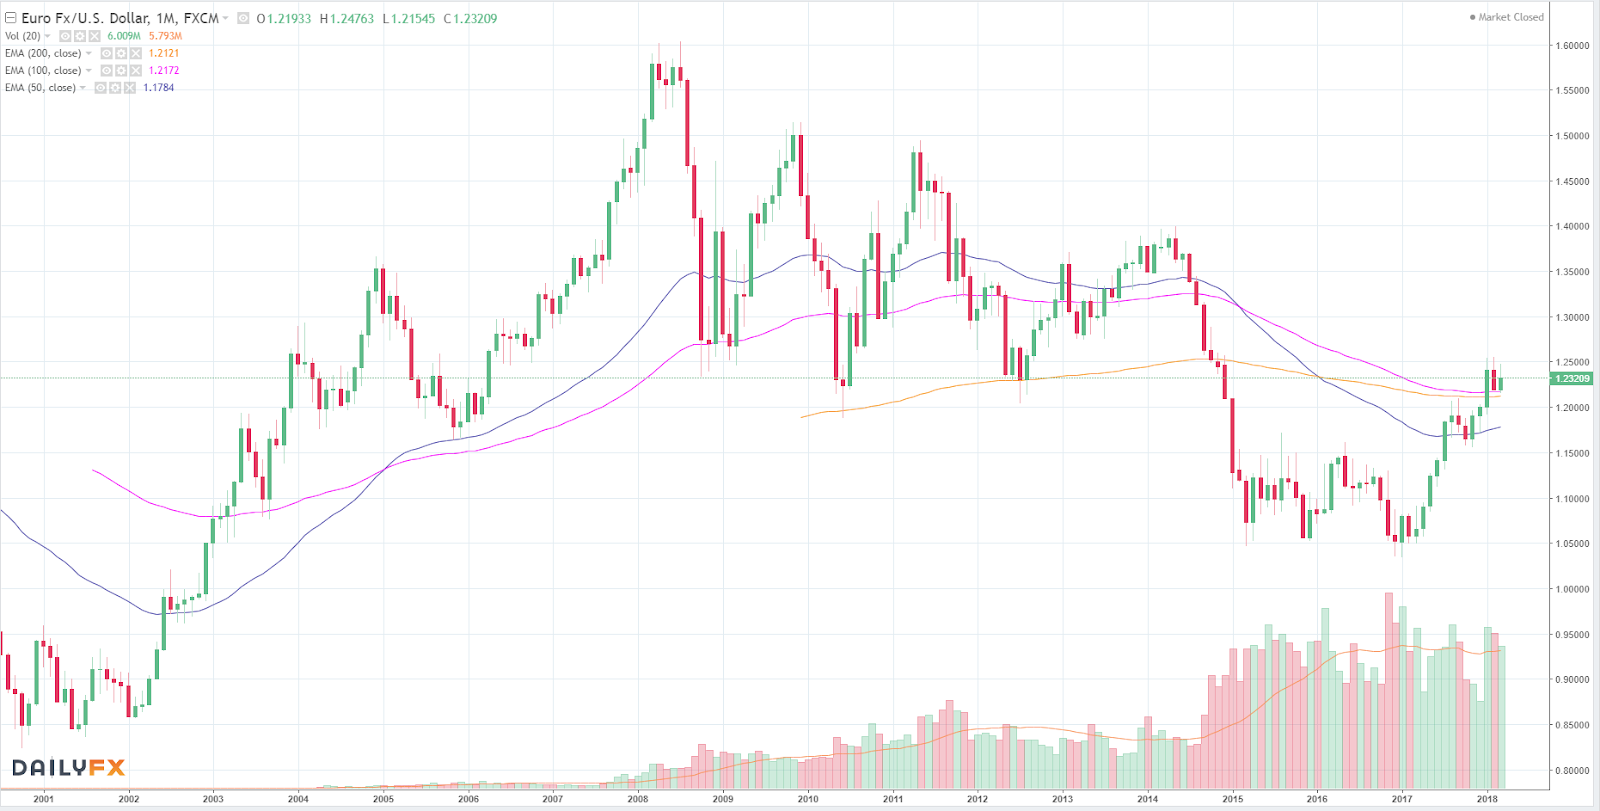
The euro is the most heavily-weighted against the US dollar in the US dollar index. That is because it serves as the common currency for the Euro area. Its strength this year was largely responsible for the US dollar's weakness. From the opening bell (OK, the second opening bell), we saw a large, sustained rally that hardly looked back. Peaking at 1.21 in Q3, it fell back to test 1.16, held, and then rallied back to highs to close out the year:


The monthly chart bears little resemblance to the other majors. While we see the same decline up until 2015, the action since then was neutral until this year. What we are seeing so far is a classic rectangle that is reversing the trend. Will this break above resistance hold?


The Japanese yen was the most boring of the majors. Volatility is cyclical, so that might mean we will see some better trading conditions this year. There were three major highs put in this year, the last being the highest, above .0093. However following that peak, we saw a decline back to support around .00875. Essentially what we see here is an early-year rally to a large sideways pattern. Interestingly, it appears as if a triangle is forming now, as the trendlines delineate:


Zooming out a bit, we can see that a major low was put in at .007945 back in 2015. Last year was a strong one for the yen until the last few months. That decline led into this year's consolidation. It is extremely difficult to determine if this is just a pause in a huge downtrend, or a pending reversal. We have the higher low, but we need to see sustained trading above .01 before being long is advisable:


Finally we are going to look at the Swiss franc. The daily chart looks most similar to the Aussie dollar, which is odd because the two have little in common. Sometimes that is just how things are though; just because there is correlation doesn't mean that there is a reason for it. We see a brief push above 1.06 in the summer, but the market fell back to parity, held that, then rallied (parity is 1, meaning 1 franc buys 1 dollar). We are seeing higher highs and higher lows now:


Trading activity in the last five-ish years in the franc, to be frank, has sucked. During the European sovereign debt crisis in 2011 it spiked to 1.4167, but following that, it has been a long, dull, sideways market:


So those are some of the major US dollar components. Let's now look at the actual dollar (I'll look at the US dollar ETF, $UUP). The monthly chart shows a strong rally in 2014 and the beginning of 2015. We saw another leg to a high in 2016, but 2017 was a year of declines, with a major low being put in. This low was put in at a critical level, so it is going to be interesting to see if it holds:


What next?

The USD might be forming a broadening formation, as evidenced by the higher highs and lower lows seen since 2015. I think it is likely that at least a temporary low is put and and we see a push back into the center of this formation.

The Aussie dollar, British pound, and Canadian dollar are all forming potentially bearish wedges or channels. They are bearish because they are against the prevailing trend, which is down.

The euro is currently above resistance from the rectangle that it broke out of. As long as that level holds, the picture is bullish.

The yen has been very sideways this year and is forming a symmetrical triangle right now, I want to wait and see how we break out from that.

Finally, the Swiss franc has been extremely rangebound for years, and until a decisive move is made, there is no reason to expect that to change.


Energy

Oil began the year rangebound between about $51 and $54. Consensus was that this was a fair price range. We saw a breakdown to the $47 handle, and then a rally back into the previous range. That topped out in the middle of the $53 handle. From there, 2 declines took us to what would be the low of the year, at $42. A strong rally ensued for the second half of the year, closing out above $60:


The monthly chart of crude oil is one of my favorites at the moment. A massive, complex head and shoulders pattern has formed. There are 2 shoulders on each side of the head. Following the completion of the final shoulder, we have had 4 months of gains. The target on this move is around $68, but there is a lot of resistance higher than that which may be tested:


Natural gas was a boring market this year. A decline at the end of last winter was followed by a rally, and then another decline into a consolidation pattern that lasted for most of the year:


The monthly chart doesn't look much more exciting, unless you're including the crazy spikes in 2005 and 2008. More recently, however, the market has been anything but exciting. This year was especially dull, as the last 12 bars attest to:


What Next?

Oil looks set to continue its rally. The trend is up and the head and shoulders pattern is playing out. It would take a major fundamental shift to turn things around.

Until natural gas breaks away from the year's range, I expect it to continue to be boring. There might be some heightened volatility in January and February.


Gold

The year in gold was positive, with a rally taking it from $1130 to $1320. An intermediate high was reached above $1360 in September. The rally started on day one of 2017. It can be broken down into multiple waves, with generally higher highs and higher lows. In July a decisive bottom was put in, and then a rally to the year's high followed. A decline into a rising broadening formation led to a breakdown to $1240 in December, but those losses were recouped and then some:


Looking at the bigger picture, things seem more ambiguous. Since the massive rally from 2006 until 2011, we have seen a decline and then a multi-year sideways formation. Will this result in a continuation higher or a reversal? I think that is a difficult call to make right now. We would need to see a move above $1400 or below $1125. One other thing to consider on this chart is the ascending triangle that is forming. That would have bullish implications:


What Next?

I lean toward being slightly bullish here on account of 2 things: the long-term trend is up and an ascending triangle is forming. Should we break out from that, the target would be roughly $1700.


Treasuries

Yield on the 10-year note ended 2017 at 2.41%, not too far from where it began. The 10-year initially rallied, but fell to test lows in March. That was the low on the year. A strong rally ensued, and then 2 more waves took us up to highs in the upper 127 handle. Since then, an extended decline has taken place, almost bringing the market back to where it began. Since mid-October, a bearish sort of wedge has been forming. That is interesting because generally this pattern forms against the prevailing trend, but in this case, it is moving with the trend:


Longer-term, the 10-year is sitting above a major support level, as marked. This is right around the 122 handle. An older, upward-sloping trendline was also tested this past year:


What next?

With the Fed expected to continue raising rates in 2018, I think it is likely that the support level around 122 is tested. It is possible that the market then turns higher to test the upper trendline. Overall, the trend here is not clear and it is a wait-and-see situation.


Agriculture

A mixed bag in the grain markets this year. We will look at corn, soybeans, and wheat.

Corn began the year with an uptrend. A breakdown from its high led to yet another uptrend, which eventually took it to 417. A sharp decline followed, and then a wedge formation formed. We saw a breakdown from that to the low on the year at 336. A push from that and a gap higher led to the range that we closed the year in. The trendline that markets the upper boundary of that wedge could still be in play in 2018:


Corn was an exciting market to be in  before 2014. Since then, like we have seen in a few other markets, an extended consolidation pattern has taken hold. This one appears to be a rectangle. It is worth nothing that the highs are getting lower, however. 300 is a major support level:


Soybeans were all over the map. A rally started the year off, putting in a high at 1080. For the rest of the first half of the year, the market declined to a low at 900. A sharp rally followed, and then we saw a decline back to a HL. Since then a channel has been building:


Things look a bit more interesting on the monthly. This year was part of what appears to be a multiyear symmetrical triangle, which means we should expect a move soon, as we are approaching the apex:


Aside from a massive rally which was immediately retraced, wheat had a pretty boring year too. Following the sharp decline from the 575 high, a bottom was put in again at 400. That will likely be an important level going forward. We bounced from that and then entered a down channel, which we are trading in now. A breach of the upper trend line may be beginning:


Wheat is also in a long-term downtrend that has come to a halt at that 400 level. Last year it was breached, but could not sustain trade below it. After testing it once this year, we had that sharp rally, but immediately came down to retest it. Since then we have been hovering above it:


What next?

Corn is trading sideways and there is no reason to expect that to change until we see a breakout. Soybeans look to be approaching the apex, and thus the breakout, of a triangle. The trend in wheat is lower, but 400 is a level to watch. 


Disclaimer: Futures trading involves a substantial risk of loss. Nothing here should be taken as a recommendation. If you need trade recommendations, then you should probably not even be trading.